
by Audra Coleman
Vizient Consulting Director, Advisory Solutions
In my 15+ years of advising hospitals across the nation about how to identify and evaluate variations in the cost of care, I’ve learned a great deal about how physicians select the products they use during surgery. And one thing is certain: physicians often don’t have a way to compare their selections to that of their peers. Providing the right product utilization information in the right way can make all the difference. Here are some of the most effective ways I’ve found to identify those cost outliers and present the total cost of care information to physicians.
Determine the cost of care
In order to determine the total cost of care (from admission to discharge), review all cost data at the procedure and physician levels, including supplies, implants, labs, accommodations, imaging, etc., and calculate the average cost per case by physician. The data may come from several different departments in the hospital, from accounting/finance to decision support. It can be time-consuming but is essential to have a full picture of the total cost of care before reaching out to physicians.
This data will allow you to identify physicians with higher costs of care, from which you can determine how their product selection and utilization are impacting their cost per case. You can compare these costs with other physicians in their peer group to identify clinically equivalent but less expensive products. You can additionally consider engaging with clinical experts such as nurses and scrub techs who can offer important insights on clinically equivalent products that other physicians are utilizing.
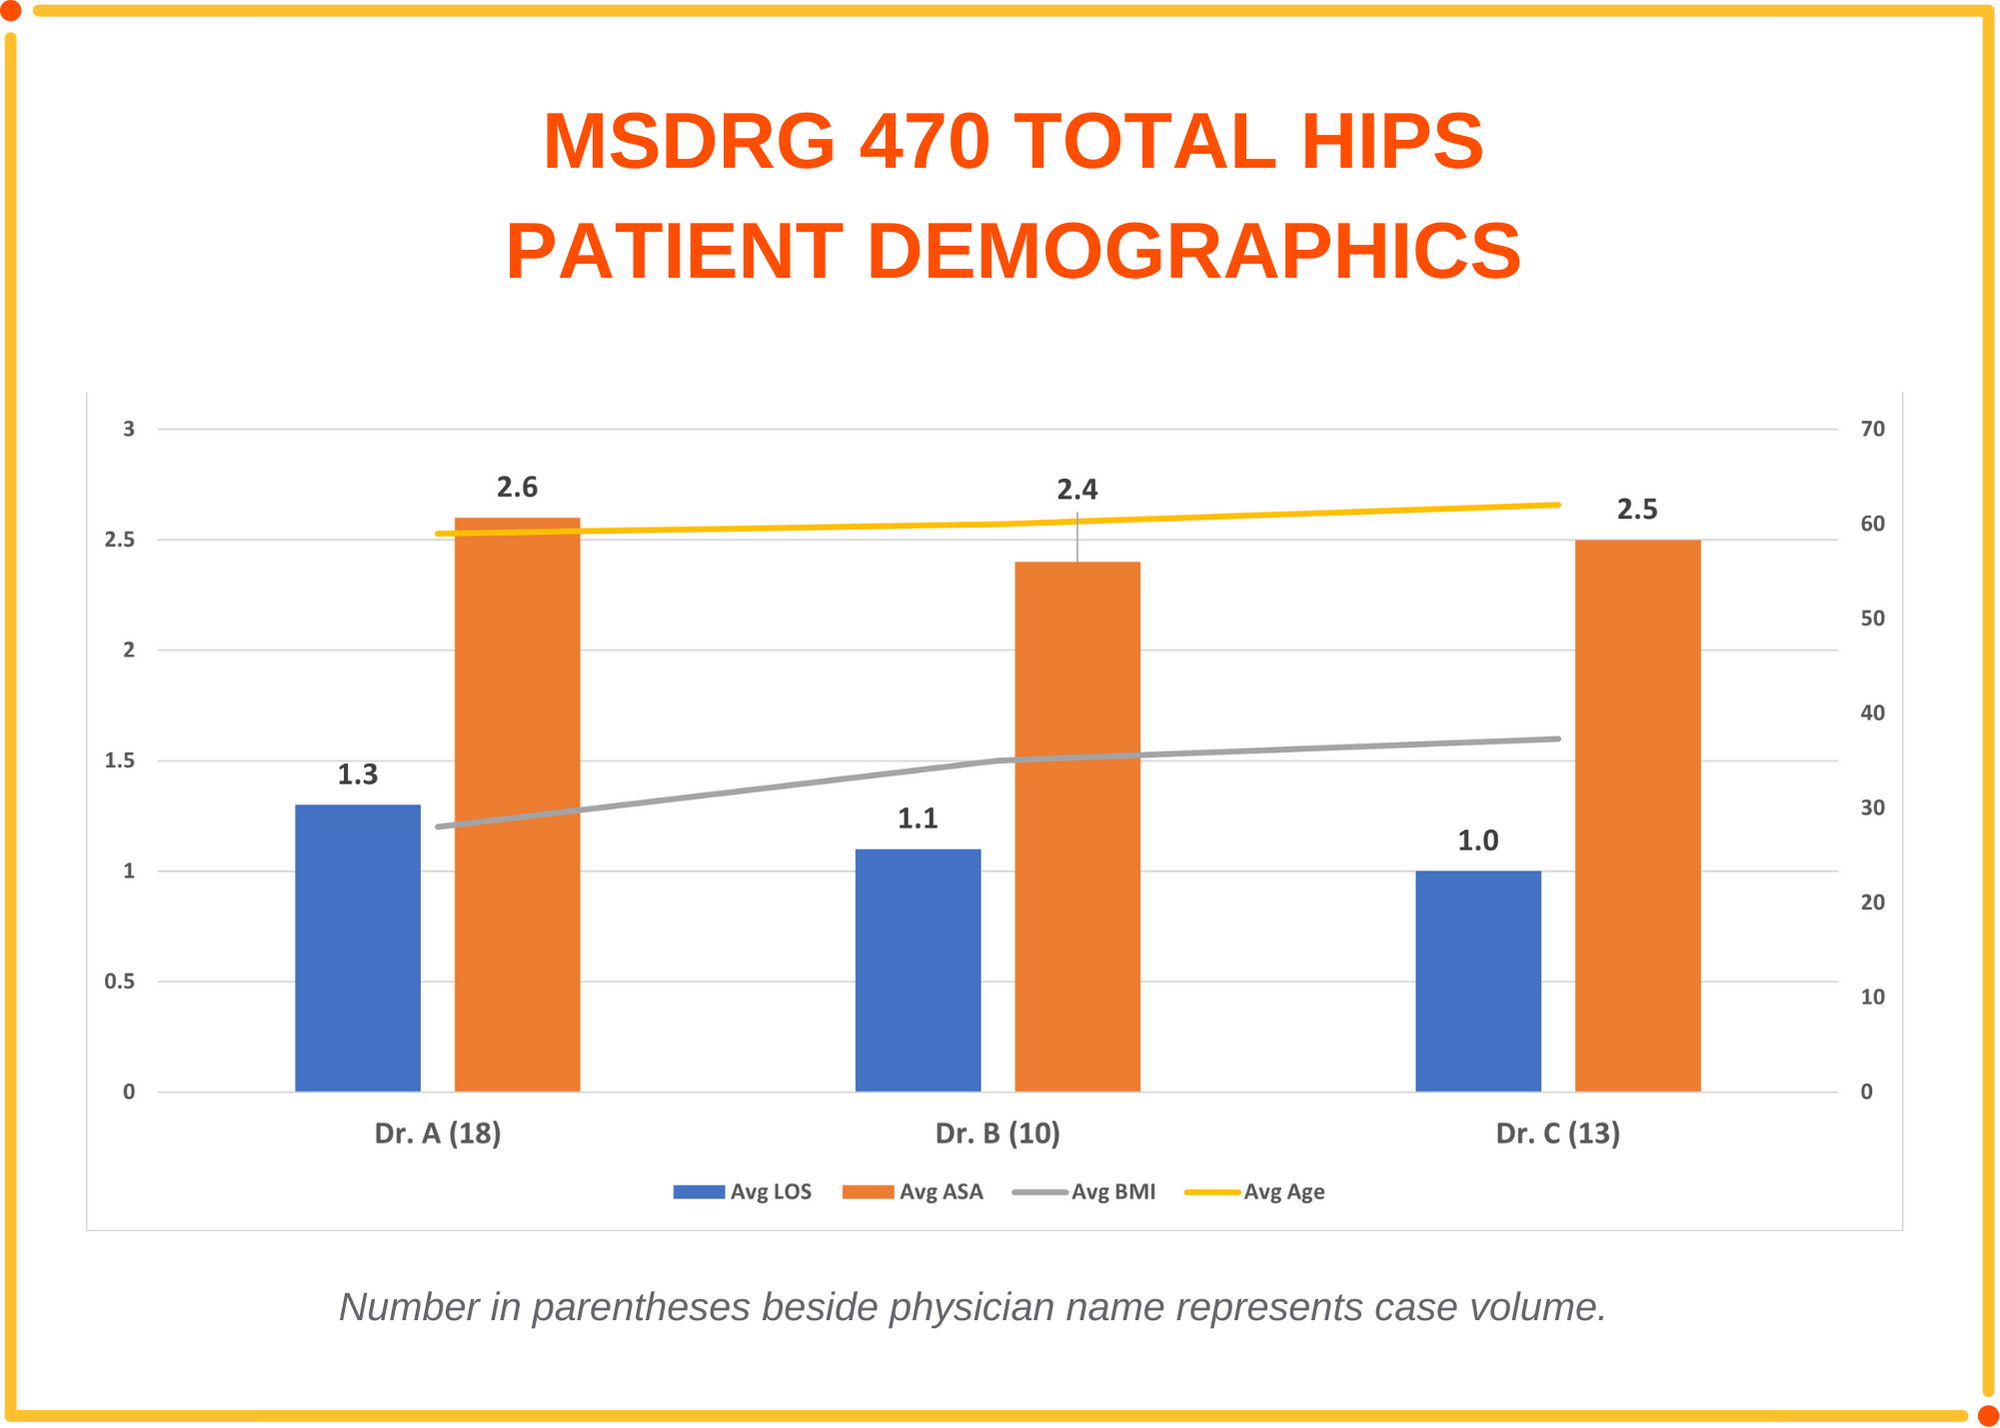
It is also important to consider the physician’s patient demographic (i.e. age, acuity, length of stay, BMI) and ensure they are equivalent to their peers as demonstrated in the graph below. The product being used may be essential to a successful clinical outcome due to the patient’s acuity or other underlying health conditions. One additional quality metric to consider is readmissions within 30 to 90 days.
Communicate the cost outliers
Now that you have the data you need, it’s time to share the data with physicians. It is key to obtain physician buy-in and earn trust by sharing validated, clean data presented in an easy-to-understand format. Depending upon the preference at your hospital, it may be able to be accomplished in a group setting with physicians. Anytime I compare physician’s data in a presentation I recommend blinding the physician’s names. Most physicians will know who they are as well as who their peers are. In the event they do not, be prepared to share with the physician privately their “blinded name” in the presentation.
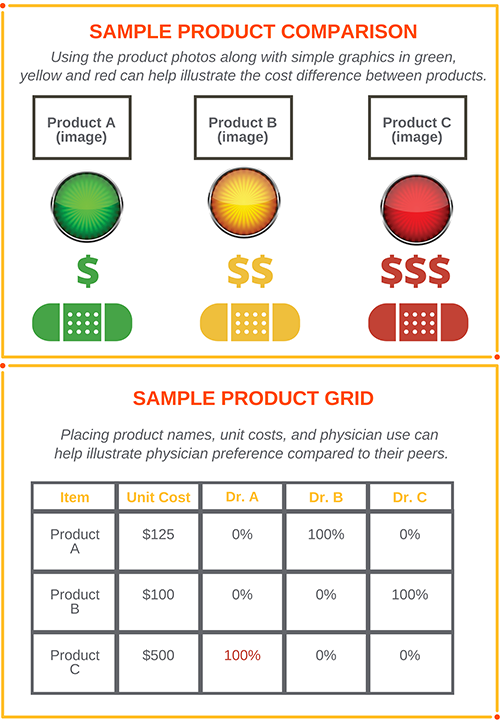
Another effective way to compare equivalent products is in a grid format that lists each of the products with the associated price along with the physician’s utilization. In this example, I can easily see that Dr. A utilizes product C at a cost of $500 in each procedure, while his/her peers utilize the less expensive clinically equivalent product A or product B at a cost of $125 and $100 respectfully. Also, the comparison group should have equivalent volumes.
I was successful at reducing the cost per case at the large hospital system on the west coast because I presented credible, validated data in a simple, straightforward, non-threatening way. This was the key to obtaining physician buy-in and earning trust by including cost per case by physician, as well as quality metrics. Having the ability to specify the exact item(s) that are driving cost is imperative to making a change.
Vizient Advisory Solutions provides powerful analytics and expert guidance to balance quality and total cost of care and reduce clinical variation, enabling consistent delivery of high-quality, cost-effective care. Email me if you’d like to learn more.
About the author
Audra Coleman is a consulting director responsible for providing savings opportunities to members by making clinical recommendations to reduce variation and cost without impacting quality or outcomes. She engages directly with physicians in analyzing practice patterns and recommends less expensive clinically equivalent alternative products that will provide cost savings to physicians and hospitals.